In this lab, we used an Inertial Balance to measure inertial mass by comparing the balance's different resistances to oscillation due to increasing mass.
 |
| The balance oscillates side to side. A piece of tape is attached to the tip of the balance that goes through the photogate. The photogate then measures the period. |
For trial one, we added no mass onto the balance, pulled it back and released the inertial balance until the computer started to measure a reasonable period. To make sure results were reasonable, it was a good idea to time some number of oscillation per some number of seconds to estimate the period. The picture below shows our calculated results compared to the LoggerPro results proving valid results.
 |
| The LoggerPro was proven reasonable since our personal estimation came close to the actual results of the period produced by the LoggerPro. |
Once the period of the tray with no extra mass was recorded, we then repeated this process after adding 100 grams of mass and centering it with some masking tape before recording the new period of oscillation. We recorded the new period of oscillation for every 100 grams added onto the balance. The picture below shows our data recorded on the right (mass in kilograms and period in seconds). The left of the picture below shows our data graphed.
.png) |
| As you can see, the graph is curved concave up. |
After receiving the data and graphing it, we then used it to interpret the relationship between mass and period for an inertial balance.
We guessed that the period was related to the mass by some power-law type of equation:
T = A(m+Mtray)^n
This gave us three unknowns- A, M, and n. The rest of the lab was our process in finding these unknowns.
First we took the natural logarithm of each side:
lnT = nln(m+Mtray) + lnA
We then created a data table with lnT vs ln (m+Mtray), making an educated guess for the the mass of the tray equal to 300 grams.

Using these values, the data plotted would therefore have to be linear since the equation is in the form of y = mx + b.
Once we graphed these values, we did our best in adjusting our guess of the mass of the tray (Mtray) until the graph became as linear as possible.
In trying to get the most linear straight line, we wanted the slope to be as close to 1 as possible, reaching a range of different masses that produced the best correlation coefficient of 0.9998.
 |
| This graph represents the linear graph with the lowest mass of the tray where the correlation coefficient was still 0.9998 (Mtray = 253grams). |
 |
| This graph represents the linear graph with the highest mass of the tray where the correlation coefficient was still 0.9998 (Mtray = 295grams). |
Now we could use the slope and y-intercept of these two graphs to find the lowest and highest possible answers to the unknowns in the period to mass equation: T = A(m+Mtray)^n
Using lnT = nln(m+Mtray) + lnA, the slope was n and the y-intercept was lnA.
We found that the equation for the lowest Mtray value was:
T = 0.689 (m+.353)^0.6213
And the equation for the highest Mtray value was:
T = 0.672 (m+.295)^0.6650
To check the accuracy of these equations we used two unknown masses and recorded their period.
The period of the lighter Unknown mass one was .474 seconds and the heavier Unknown mass two had a period of .383 seconds.
Using these equations we found a mass range in grams.
Unknown one was a tape roll with a mass range of: 134 grams-135 grams
Unknown two was a calculator with a mass range of: 294 grams-296 grams
Our equations were close since the actual masses were within the calculated range.
 |
| The actual mass of Unknown one |
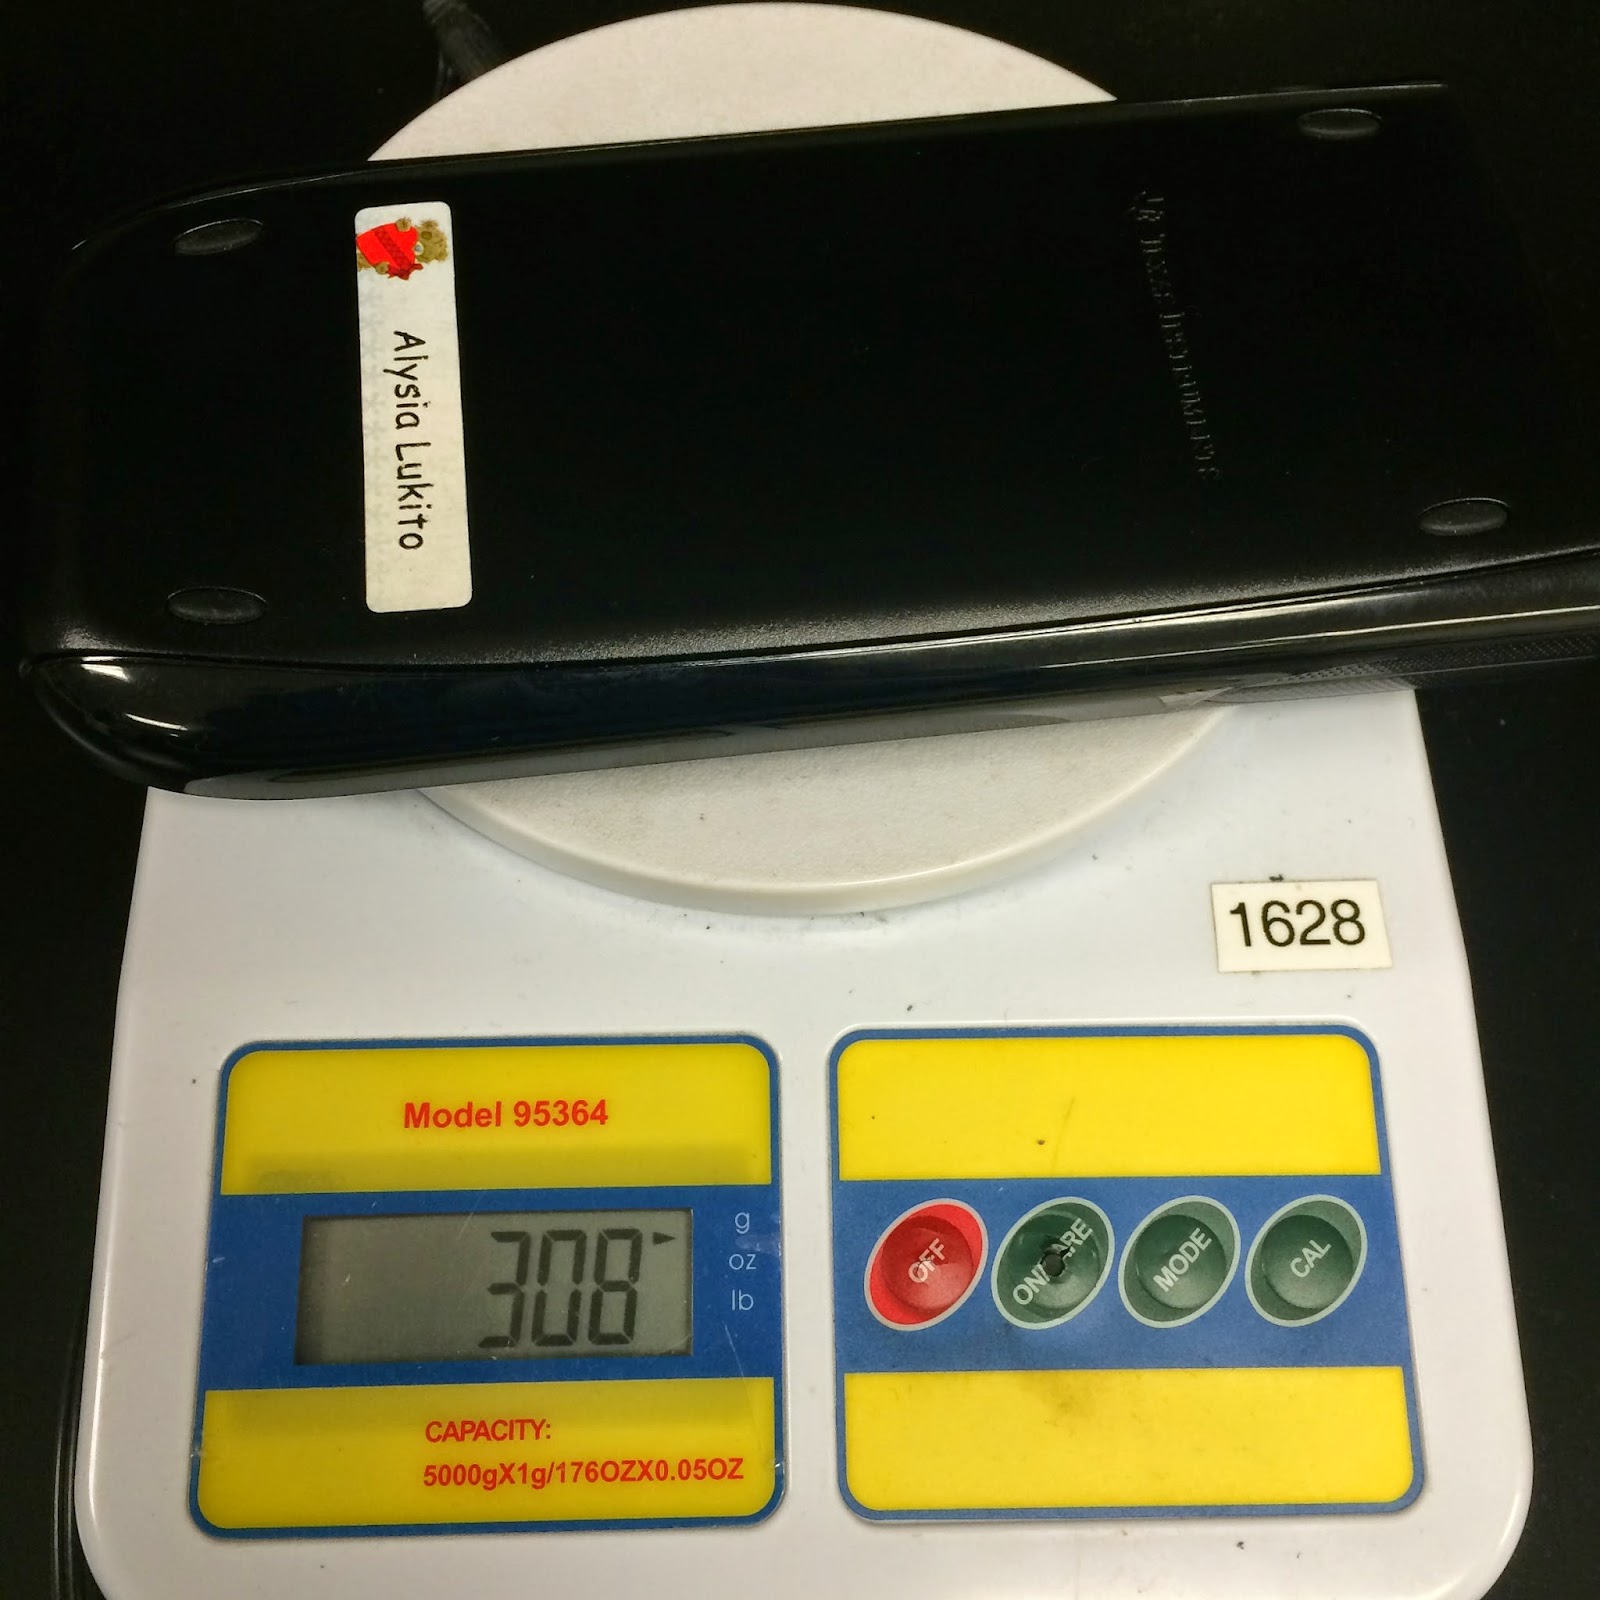 |
| The actual mass of Unknown two |
In conclusion, we found the relationship between the period of oscillation for the inertial balance and the mass added. After recording the period of the inertial balance after adding more mass each trial, the data proved to change and therefore we assumed some type of power-law equation. Using the logarithmic data graphs, after figuring out the mass of the tray, we found the unknown constants creating two equations that represent a the period/mass relationship. After proving the equations work in finding unknown masses, unknown mass one with a 0% error and unknown mass two with a 4% error, our results were proven close in accuracy even accounting for human error in recording a rough estimate of the period oscillation. Overall the lab was successful in finding the relationship between the recorded changing periods and the added masses.
No comments:
Post a Comment