Part 1:
To find the angular acceleration of spinning objects (in this case disks).
To use this data to find the relationship between linear acceleration versus angular acceleration, observe the effect of changing the hanging mass, effect of the radius on which the hanging mass exerts a torque, and the effect of changing the rotating mass.
Part 2:
To compare the theoretical moment of Inertia to the experimental moment of Inertia.
Set up:
We wanted to apply a known torque to the rotating disk so we used a string wrapped around the small disk, above the larger one, to be pulled by a hanging mass off of a pulley, creating a known torque and a measurable rotational acceleration of the disk. To measure the rotational acceleration, we used equipment that recorded this acceleration by counting the lines marked on the sides and converting the data onto a graph of angular acceleration on the table. Air flow between the two large disks allowed only the upper disk to be rotated with the small disk that had the string wrapped around it.
 |
| Air flow between the two steel discs makes them almost frictionless |
 |
| Hanging mass being dropped |
 |
| Therefore, an average of the descending and ascending angular accelerations must be found for alpha. |
Experiment 1:
We let the mass drop and recorded the angular acceleration as the 25 gram mass dropped down and back up again, shown below:
 |
| Hanging Mass Only, Small Torque, Top Steel Disk Angular Acceleration |
 |
| Hanging Mass Only, Small Torque, Top Steel Disk Linear Acceleration |
Experiment 2:
Angular acceleration with the same set up as experiment 1 but with a hanging mass with twice the hanging mass:
 |
| 2x Hanging Mass, Small Torque, Top Steel Disk Angular Acceleration |
Experiment 3:
Angular acceleration with the same set up as experiment 1 but with a hanging mass with three times the hanging mass:
 |
| 3x Hanging Mass, Small Torque, Top Steel Disk Angular Acceleration |
Experiment 4:
Angular acceleration with the same set up as experiment 1 but with a larger torque due to a larger "massless" disk creating a larger radius on which the hanging mass' string is wrapped around:
 |
| Hanging Mass Only, Large Torque, Top Steel Disk Angular Acceleration |
Experiment 5:
Angular acceleration with the same set up as experiment 4 but with an aluminum top disk being rotated affecting the rotating mass:
 |
| Hanging Mass Only, Large Torque, Top Aluminum Disk Angular Acceleration |
Experiment 6:
Angular acceleration with the same set up as experiment 4 but with both the top and bottom steel discs being rotated affecting the rotating mass:
 |
| Hanging Mass Only, Large Torque, Top Steel + Bottom Steel Disk Angular Acceleration |
Data Analysis of Part 1:
Angular Accelerations Collected from Experiments 1-6:
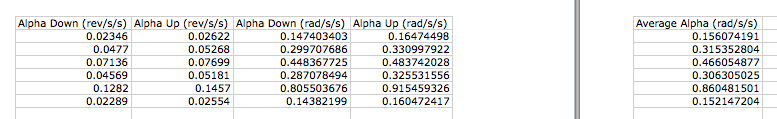 |
| Alpha Data Table in rad/s/s |
Overall Data:
 |
alpha = angular acceleration
a= linear accelertion
(hmmm my calculations dont look to good....PIC)


Overall, our set of measured data is shown below:

Although the relationship between the angular accelerations in part 1 remain the same, we had to multiply them by a factor, since we recorded the data in the wrong setting on Logger Pro. This is for a more accurate set of data of the angular accelerations shown below:

Now that the data from part one is organized and accurate, we have all the data necessary in calculating the experimental inertia and comparing it to the theoretical inertia.
Equations


Effects of changing the hanging mass with Experiments 1, 2, and 3:
Hanging mass of Experiment 1 = 24.6 grams
Hanging mass of Experiment 2 = 49.6 grams
Hanging mass of Experiment 3 = 74.6 grams
where m = hanging mass = about 25grams

Effects of changing the radius on which the hanging mass exerts a torque with Experiments 1 and 4:
Diameter of the small "weightless" disk: 2.5cm
Diameter of the large "weightless" disk: 5.0cm
where r = d/2

Effects of changing the rotating mass with Experiments 4, 5, and 6:
Rotating Mass of Experiment 4:
 |
| Mass of Top Steel Disk = 1.3481 kg |
Rotating Mass of Experiment 5:
 |
| Mass of Top Aluminum Disk = 0.455 kg |
Rotating Mass of Experiment 6:
| 2x = 2.696 kg |
| Mass of Top and Bottom Steel Disk |
Relationship between rotation mass and the angular acceleration:

Data Analysis of Part 2:
Measured Data:
- the diameter and mass of the top steel disk: 12.65cm +- .002, 1.348kg +- .001kg
 |
| Diameter of Steel/Aluminum disks: 12.65 cm +- .002 |
- the diameter and mass of the bottom and steel disk: 12 cm, 2.696 kg +- .001kg
- the diameter and mass of the top aluminum disk: 12cm, 0.455 kg +- .001kg
- the diameter and mass of the smaller torque pulley: 2.5 cm +- .02cm, 9.9g +- 0.1g
 |
| Mass of Small Disk = 9.9 g |
- the diameter and mass of the larger torque pulley: 5.00cm +- 0.02cm, 36.0g +- 0.1g
 |
| Mass of Large Disk = 36.0 g |
- the mass of the hanging mass supplied with the apparatus: 24.6g +- 0.1g
 |
| Mass of Hanging Mass = 24.5 g +- 0.1g |

Although the relationship between the angular accelerations in part 1 remain the same, we had to multiply them by a factor, since we recorded the data in the wrong setting on Logger Pro. This is for a more accurate set of data of the angular accelerations shown below:

Equations
Experimental Moment of Inertia:
Derived in class and on the handout, we used the free body diagram of the hanging mass and the experimental angular accelerations to find the reduced equation.
If there was no friction in the system (taken account for by finding the average angular acceleration), then the experimental equation would by how it is shown below:

Theoretical Moment of Inertia:
The theoretical calculation of a disk's inertia is:
Derived in class and on the handout, we used the free body diagram of the hanging mass and the experimental angular accelerations to find the reduced equation.
 |
| Free Body Diagram |
If there was no friction in the system (taken account for by finding the average angular acceleration), then the experimental equation would by how it is shown below:

Theoretical Moment of Inertia:
The theoretical calculation of a disk's inertia is:
I = (1/2)MR^2
Actual Calculations Compared:
(since data was changed, calculation of inertia edits credited to Alysia Lukito)
(since data was changed, calculation of inertia edits credited to Alysia Lukito)


% Error:
In comparing inertias, we were looking at the inertia of the steel disk, aluminum disk, and the two disks combined. For the first % error of the top steel disk, the average was taken from experiments 1,2,3, and 4 while the second % error is from experiment 5 for the aluminum upper disk, and the third % error was from experiment 6 for both disks combined.
 |
| (Percent Error was edited as well by Alysia Lukito) |
Conclusion:
In the data analysis of part 1 each of the three sections had different reasons for not having an exact relationship. When looking at the different hanging masses of experiments 1-3, the masses were not exact multiples of each other, which meant that the angular accelerations of each experiment would be close but not be exact multiples of each other as it is in theory for determining their relationship. When looking at the radius, the relationship fit with little percent error although sigfigs could still have been a factor. When looking at the different torque, incorrect mass may have been a factor in assuming the top steel disk and the bottom steel disk were equal mass.
In the data analysis of part 2 we see very small, under 5 %, error in the experimental inertia versus the theoretical inertia of the top disks. When comparing the inertia of the disks combine we seem to have a 28% error in which we agreed may have been caused by friction unaccounted for by the axis or not putting the cap on tight enough to avoid friction of the two plates with the surface below.
In the end we were proven that T=Fr=I(alpha), confirmed in the first part by deriving different manipulations of the equation that proved this relationship accurate of the different angular accelerations recorded after changing their radius, mass, and torque. We then proved this relationship in finding inertia and using the derived formula of inertia for a disk 1/2 MR^2 found by integral, which were almost the same for the aluminum disk and steel disk.
No comments:
Post a Comment