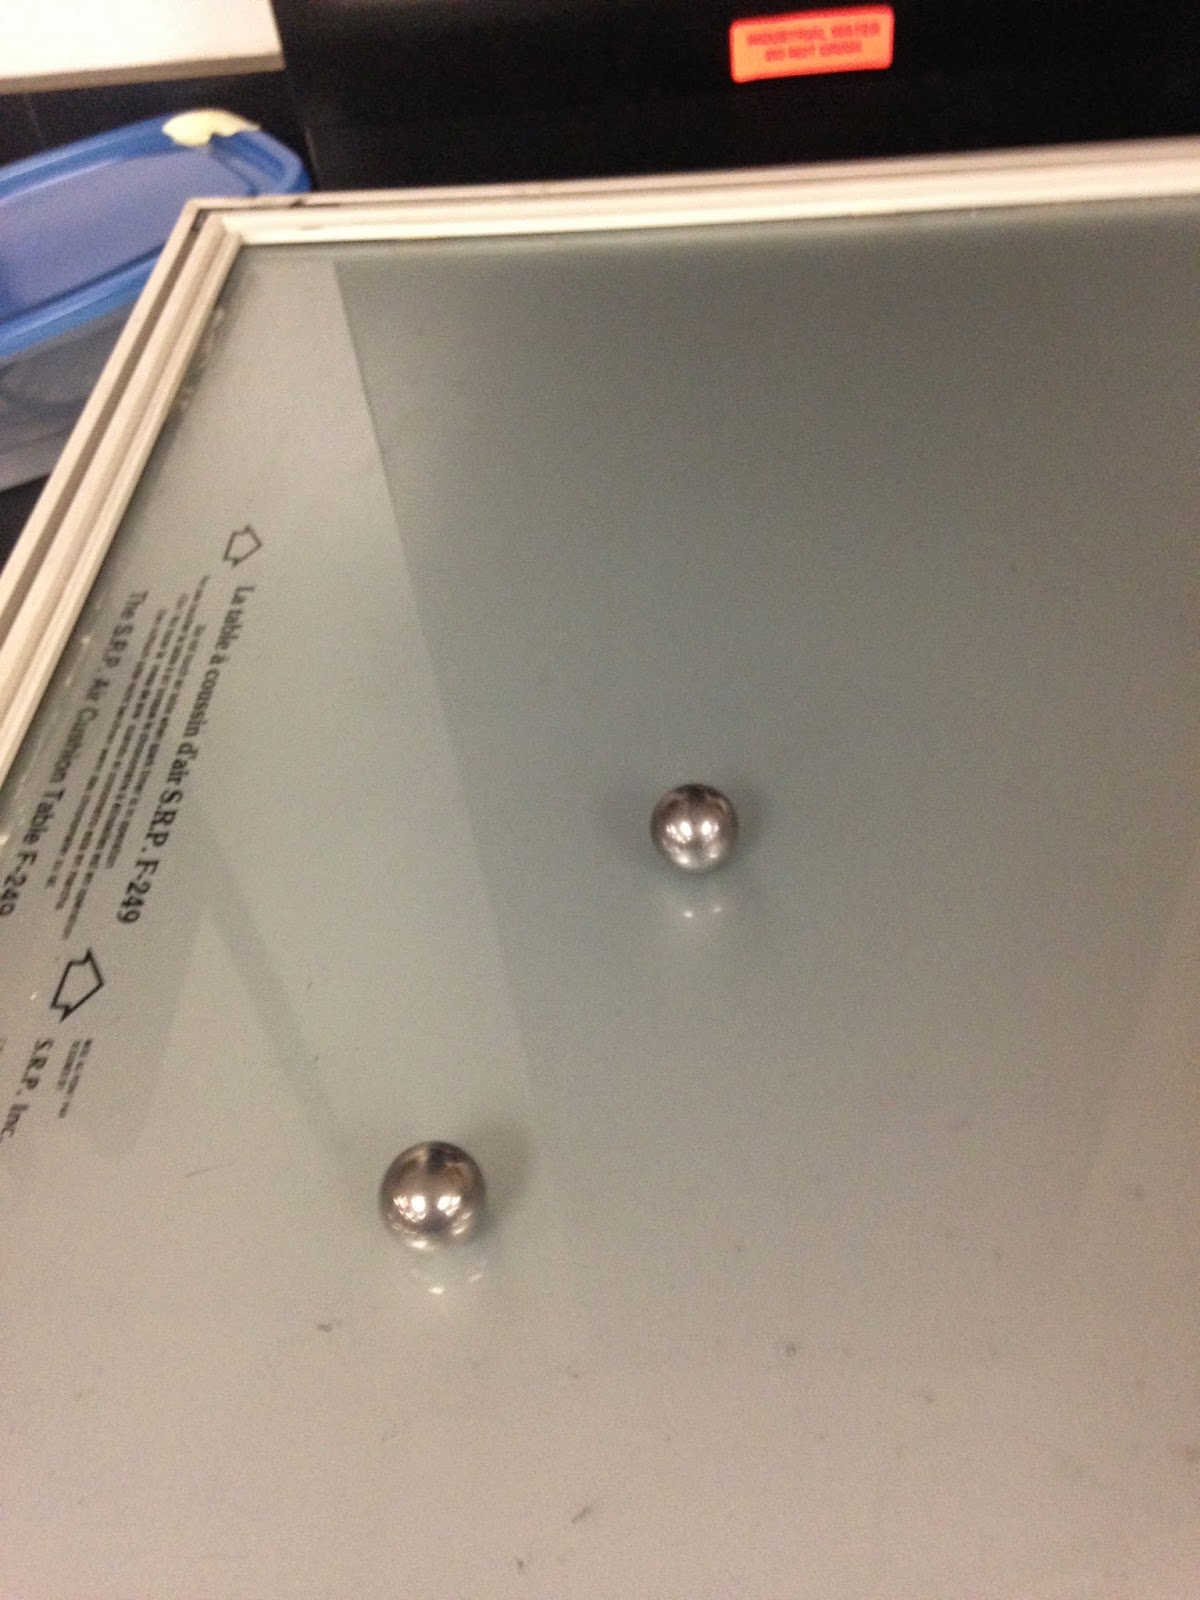
First Experiment: Steel ball with a steel ball
Once we set up the Video Capture on LoggerPro, we put one steel ball onto the glass and made sure it did not roll. If the ball stayed in place, it meant the glass table was level and that no outside forces would skew the data. We then rolled the other ball into it, recording the collision.
(video)
Once recorded, we then analyzed he position versus time. To receive this data we had to scale the video captured by first finding out how long one side of the glass table square was:
 |
| .65 meters |
After scaling the video, we were ready to set the origin. We made sure to set the position of the first and the only ball moving onto an axis. We then put a point on the first ball's center of mass after each frame of the video. We then created a position graph show below.
 |
| Position of x and y components of both steel balls |
 |
| Velocity of x and y components of both steel balls |
 |
| Mass = .067 kg |
 |
| Conservation of Energy |
Then we found the momentum of each steel ball by taking the mass times the velocity of each component of each ball. We then added the momentum of the x components and the momentum of the y components shown below.
 |
| Conservation of Momentum |
Experiment 2: Steel ball with an aluminum ball
We then recorded a collision with a steel ball and aluminum ball with the same volume but different masses. We created a position graph the same way we did before with the steel ball collision. The graph is shown below.
 |
| Position of x and y components of the aluminum ball and steel ball |
The velocity was automatically taken for each position graph shown below.
 |
| Velocity of x and y components of the aluminum and steel ball |
To find the kinetic energy, we needed to find the mass of each ball.
 |
| Mass of Steel Ball = .029 kg |
 |
| Mass of Aluminum Ball = .010 kg |
We then used 1/2*m*v^2 (combining the x and y components of each ball's velocity into one vector) to find the kinetic energy of each ball. We then found the total energy by adding them together.
 |
| Conservation of Energy |
The line may not be straight, but it does show an almost constant total energy proving conservation as one loses energy the other picks some up.
We then graphed the momentum of the y components and the momentum of the x components shown below.
 |
| Conservation of Momentum |
The graph shows that as the ball came in on the y axis with a momentum around .15 kg*m/s with nothing to nothing in the x direction. It also proves that even after the collision the graph stays constant since the momentum is conserved, therefore concluding us with an overall successful experiment.

No comments:
Post a Comment